

ANALYSIS OF REBARS AND STEEL PROFILES MANUFACTURING
PROCESS DEFINITION
Steel Hot Rolling and Heat Treatment are among the most important stages in steel industry, in EOSTrack we redefine them by the Machine Learning technique.
We use Finite Element Method (FEM) and Computational Fluid Dynamics (CFD) (Specifically Finite Volume Method “FVM”) to simulate the whole process.
Machine Learning is the art of relying on Numerical Analysis to simulate the real manufacturing process to a whole new level of accuracy and precision. Predicting the behavior of various scenarios needs a lot of iterations that cost a lot of time and resources whereas in our Company we can do all the iterations virtually and get very accurate results.
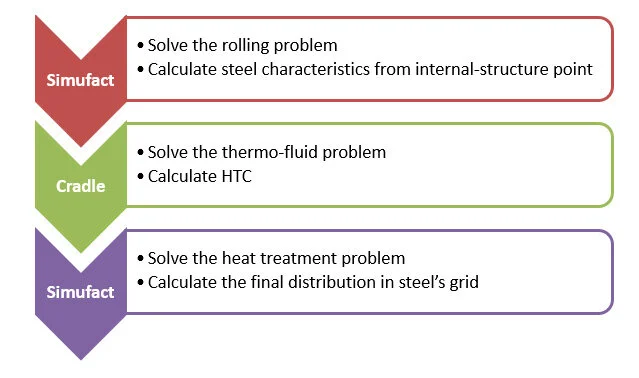
In the following flow chart, we present the general outline of the problem that will be discussed:
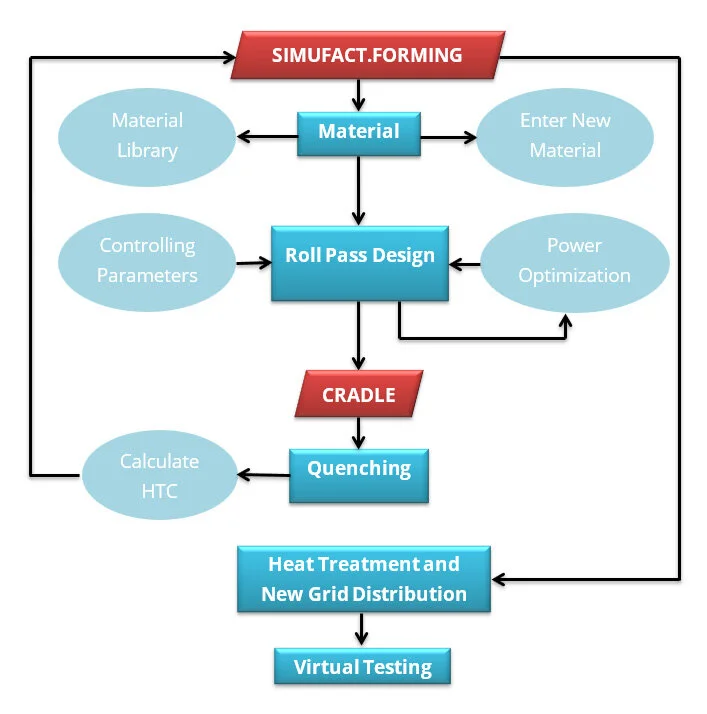
MATERIAL SELECTION
SIMUFACT.FORMING has a wide range of built-in materials that can be directly used, or it gives an option to enter a new material with its chemical composition with the aid of external software. And for each (either built-in or generated) material, Mechanical Properties Curves, Flow Curves and CCT Diagrams can be deployed. For each material, several tabs can be examined or edited. In the following figure, Chemical Composition tab is illustrated:
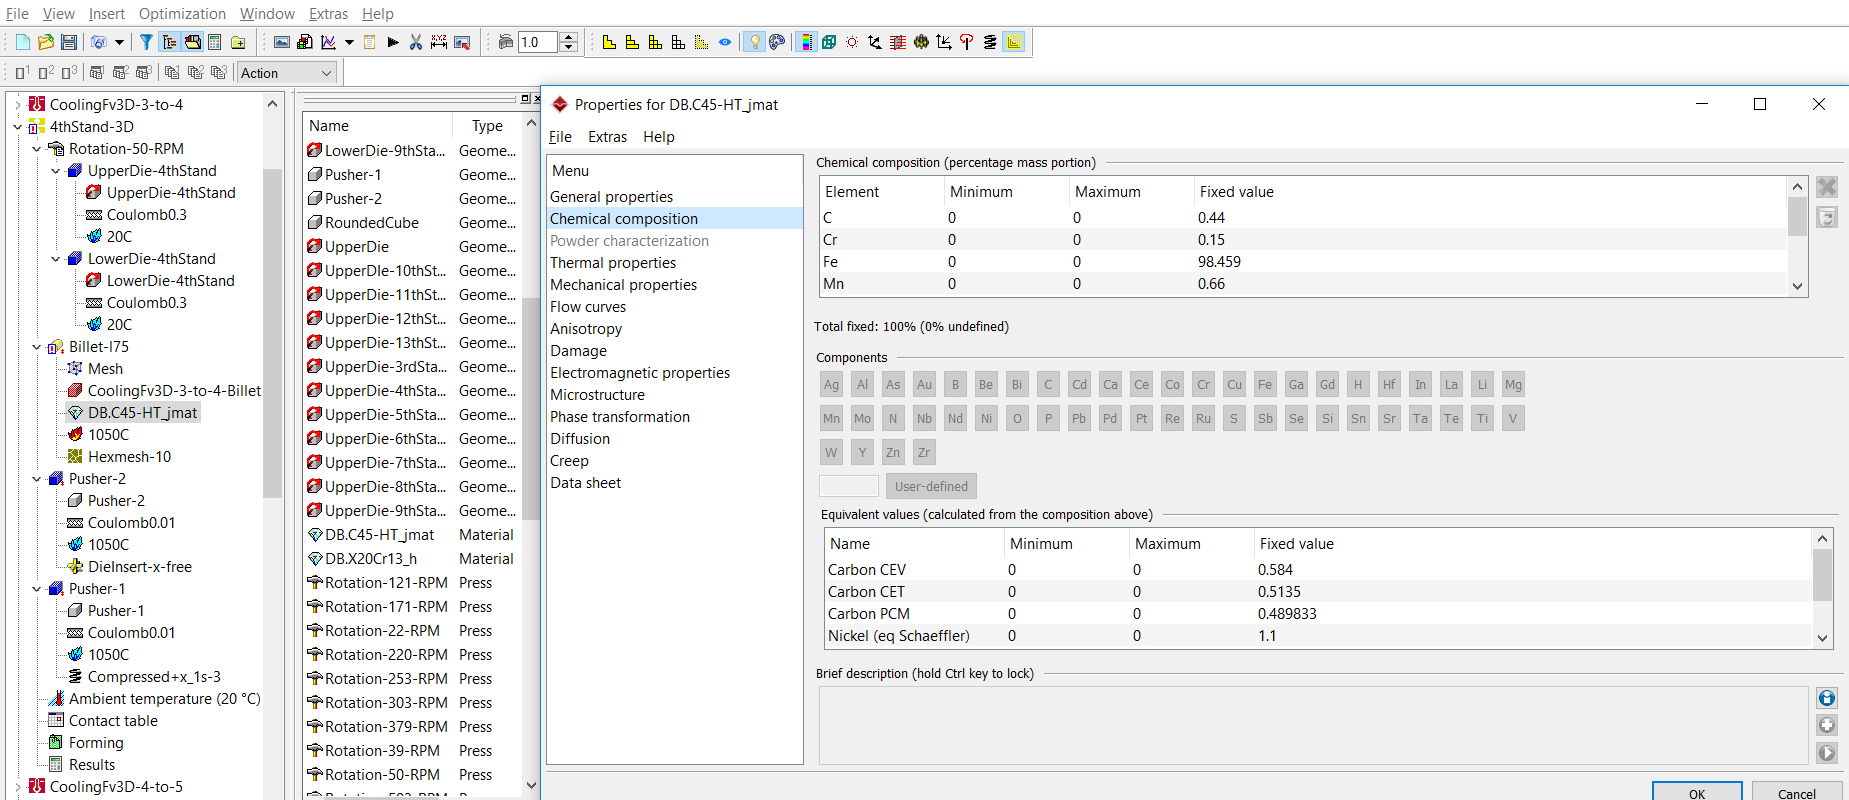
Figure 1 - Material Library of SIMUFACT.FORMING where you can enter chemical composition of the desired material.
And here, Flow Curves tab is illustrated:
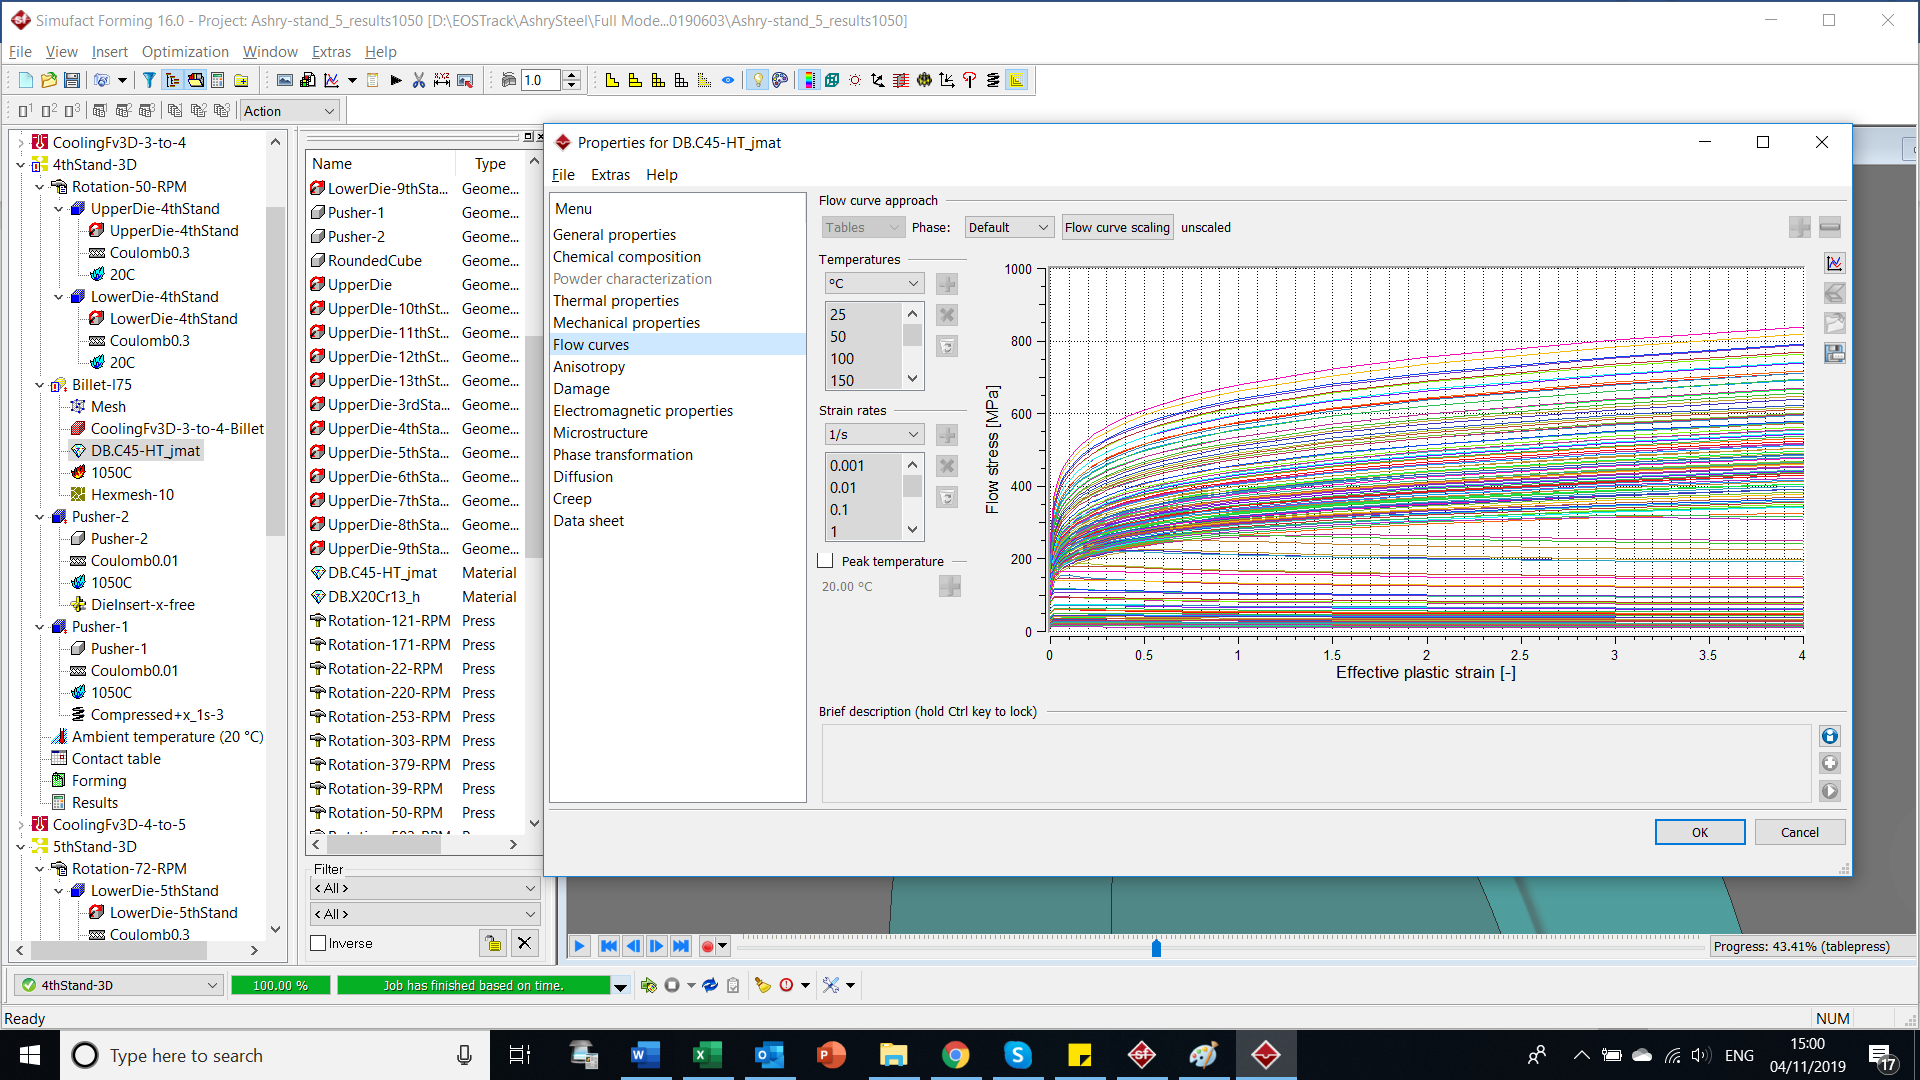
Figure 2 - Flow Curves in SIMUFACT.FORMING
There are two main types of transformation diagram that are helpful in selecting the optimum steel and processing route to achieve a given set of properties. These are time-temperature transformation (TTT) and continuous cooling transformation (CCT) diagrams. CCT diagrams are generally more appropriate for engineering applications as components are cooled (air cooled, furnace cooled, quenched etc.) from a processing temperature as this is more economic than transferring to a separate furnace for an isothermal treatment.
CCT diagrams Measure the extent of transformation as a function of time for a continuously decreasing temperature. In other words a sample is austenitised and then cooled at a predetermined rate and the degree of transformation is measured, for example by dilatometer. Obviously a large number of experiments are required to build up a complete CCT diagram.
There are two types of continuous cooling diagrams drawn for practical purposes:
• Type 1: This is the plot beginning with the transformation start point, cooling with a specific transformation fraction and ending with a transformation finish temperature for all products against transformation time for each cooling curve.
• Type 2: Same as Type 1 but against cooling rate or bar diameter of the specimen for each type of cooling medium.
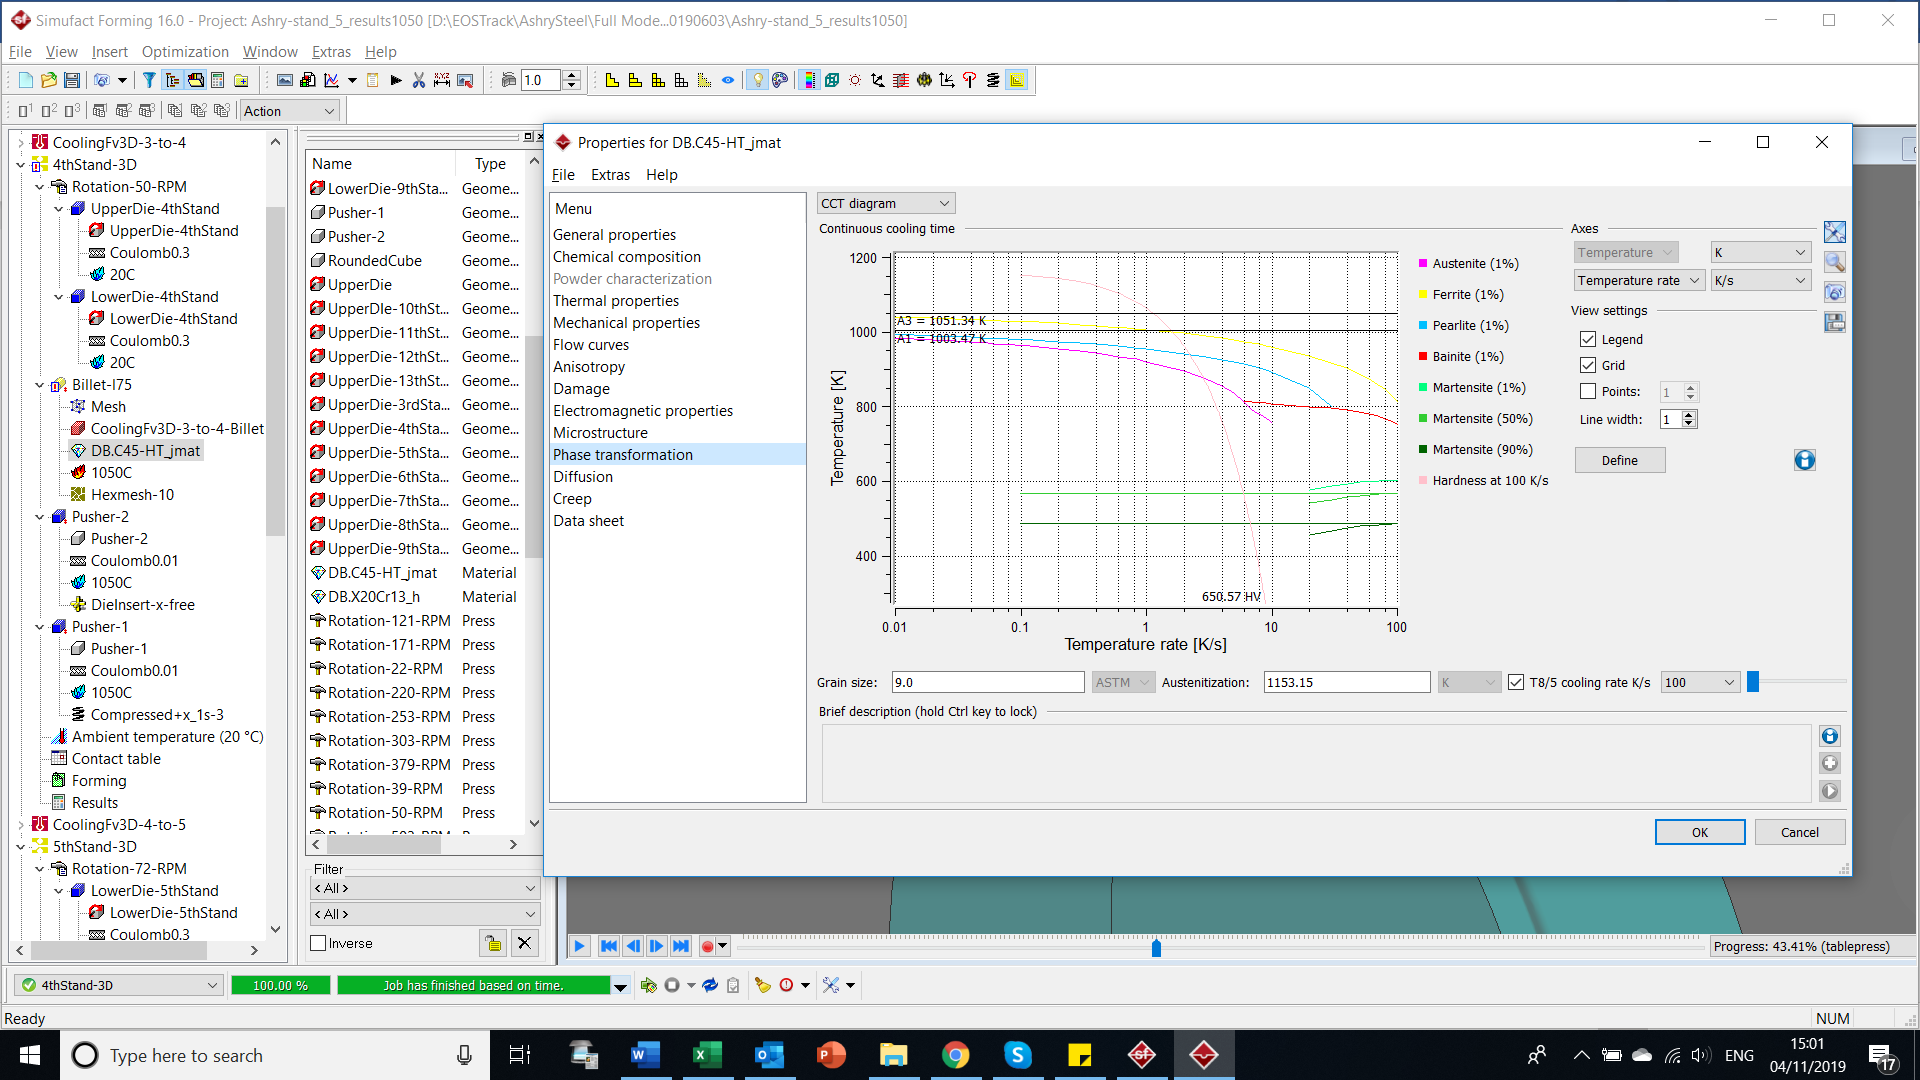
Figure 3 - CCT Diagram in the Material Library of SIMUFACT.FORMING
The most important and effective diagram used in material industries, CCT diagram which is built-in for built-in materials in SIMUFACT.FORMING or which can be generated for the new desired materials.
ROLL PASS DESIGN
Steel rolling is the main process in steel industry that produces the desired dimension, cross sections, and properties. This process starts with the Output Temperature of the Furnace, followed by the Roughing Stage, and finally the Production Line which the number of its stages depend on the reduction ratios across each stage and the final desired thickness.
Our Analysis Capabilities
We can stop at any required stage and observe its results (dimensions and mechanical properties)
We can use cooling by air or by jet water and simulate this complicated thermo-fluid-structure interaction problem, then measure the change in properties due to cooling.
We can calculate loads on bearings to maximize their operational cycles.
We can also concentrate on Die Wear, we know it is a big problem that faces steel facilities due to the absence of knowledge on:
Wear causes and consequences
Wear rate
When to change mills
In addition, when the mills face wear, it impacts the production cost, since some operators would change the rolls even before their predicted life or press them to reach the desired gap therefore causing loss in bearing’s life.
CONTROLLING PARAMETERS
Performing iterations with the listed controlling parameters on a simulation software will certainly save huge losses resulting from the physical trial and error technique in the factory workshop specifically for rolling pass design.
Initial Input
Weight of billet/bloom
Steel grade
Steel temperature before and during the course of rolling
Characteristics of finished rolled product
Dimension of section
Tolerances
Specification of mechanical properties
Surface finish of rolled product
3. Characteristics of the rolling mill
Number of stands
Roll diameter
Strength of rolls
Rolling speed
Available power of the drive motor
Available mill equipment
4. Other factors
Rolling load
Draft
Strain
Rate of heat transfer which affects the condition of plastic flow of steel material
Free flow of steel in the roll gap/groove.
A good taper/groove angle in the pass to avoid jamming.
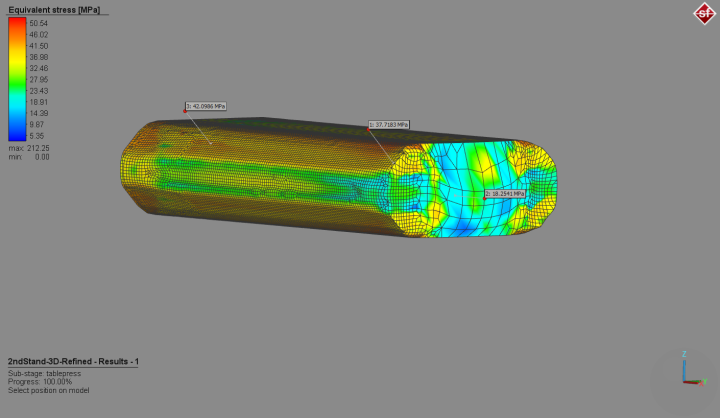
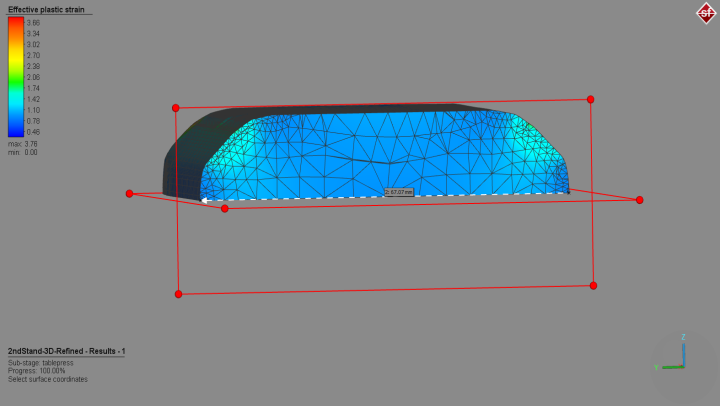
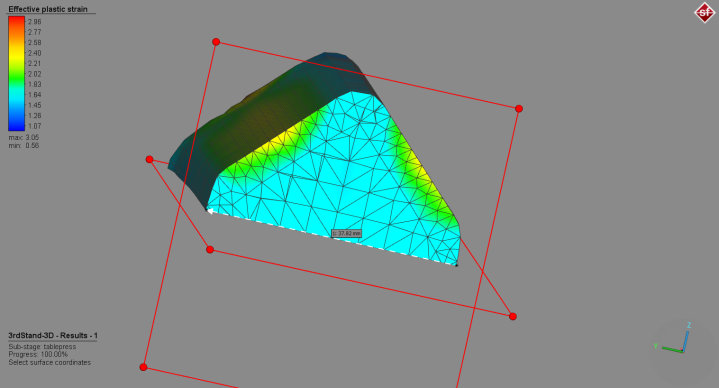
By changing the controlling parameters and observing the outputs, we deduce the change in Material’s Grid and consequently its Mechanical Properties:
QUENCHING & HEAT TREATMENT
Quenching problem is solved using SIMUFACT.FORMING with the aid of CRADLE to get the HTC (Heat Transfer Coefficient) which is used as an input in SIMUFACT.FORMING.
HTC is the parameter that relates the rate of heat transfer with the mechanism of quenching (Immersion or impingement “Spray or Jet”), and is calculated using CRADLE (The flow solver).
The formulation of Quenching problem is described as follows:
The main three cooling water configurations on run-on tables:
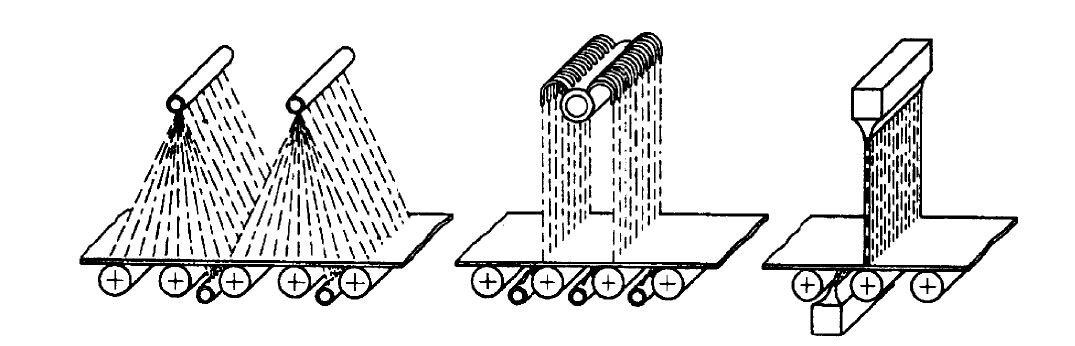
Figure 5 - From left to right: spray, laminar, and water curtain.
In CRADLE, we can choose different materials (solids, liquids, or gases). For example in our case:
The Quenchant is chosen to be liquid then water is chosen.
The metal being quenched is chosen to be solid then its grid is chosen.
The type of analysis we seek can also be chosen, either steady-state (final conditions for given initial conditions) or transient (with time).
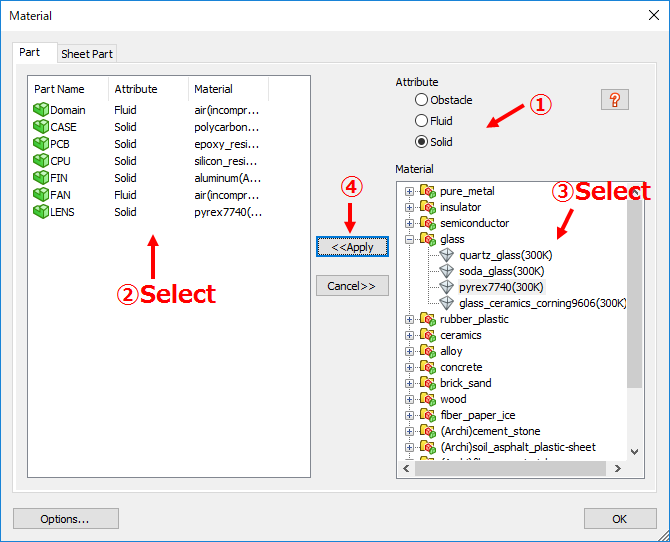
Figure 6 - There are various built-in materials in scFlow, either solids, liquid, or gases
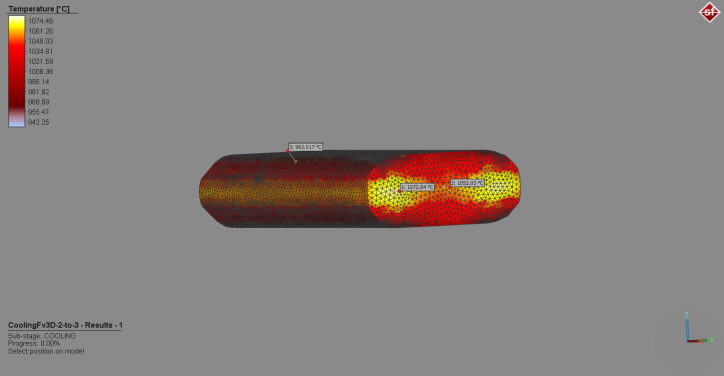
After the setup of the problem is done (Geometry – Meshing – Boundary and Initial Conditions), the solver is executed and the discretized equation are solved numerically, leading to a wide range of results that can be visualized using the post-processing software. An example is illustrated in the following figure for a temperature distribution for a cooling of hot metal sheet in ambient air:
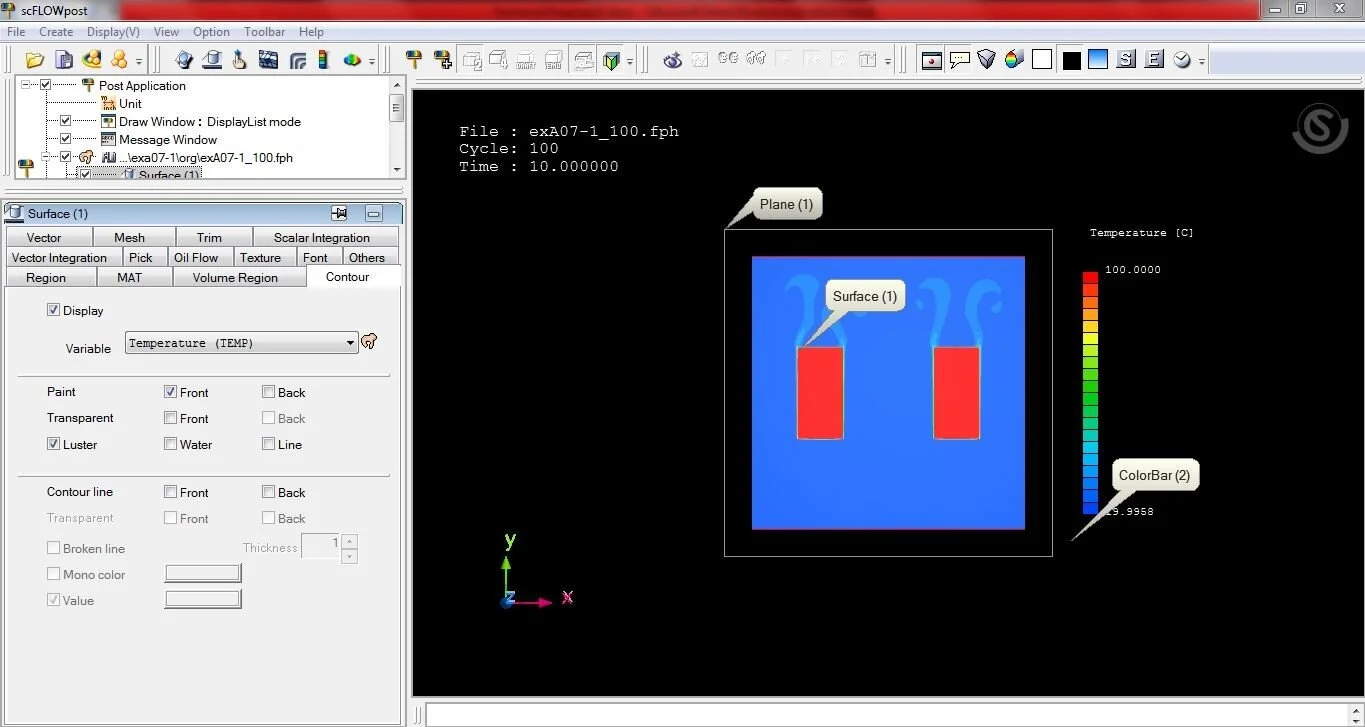
Figure 7 - Results presentation in scFlow - Temperature distribution as an example
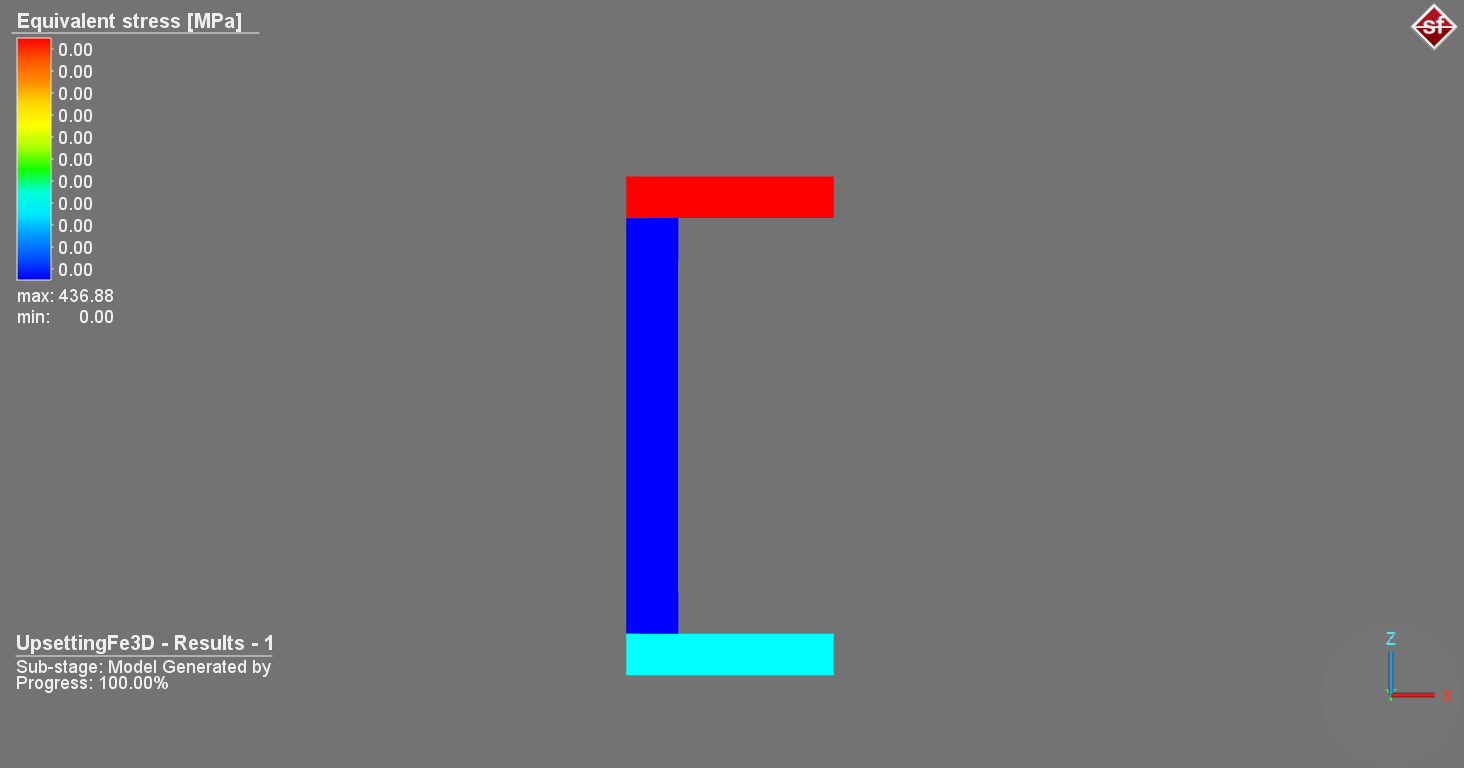
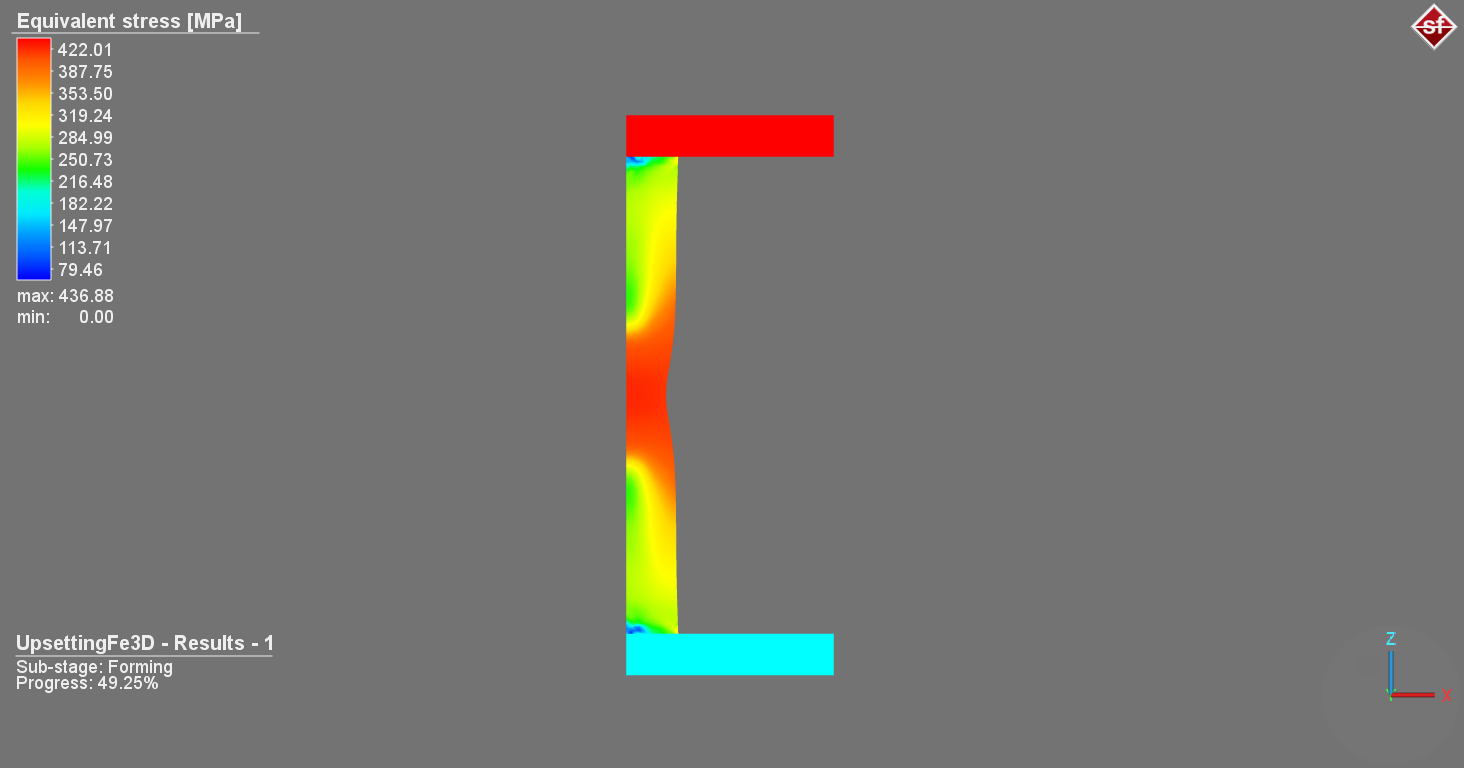
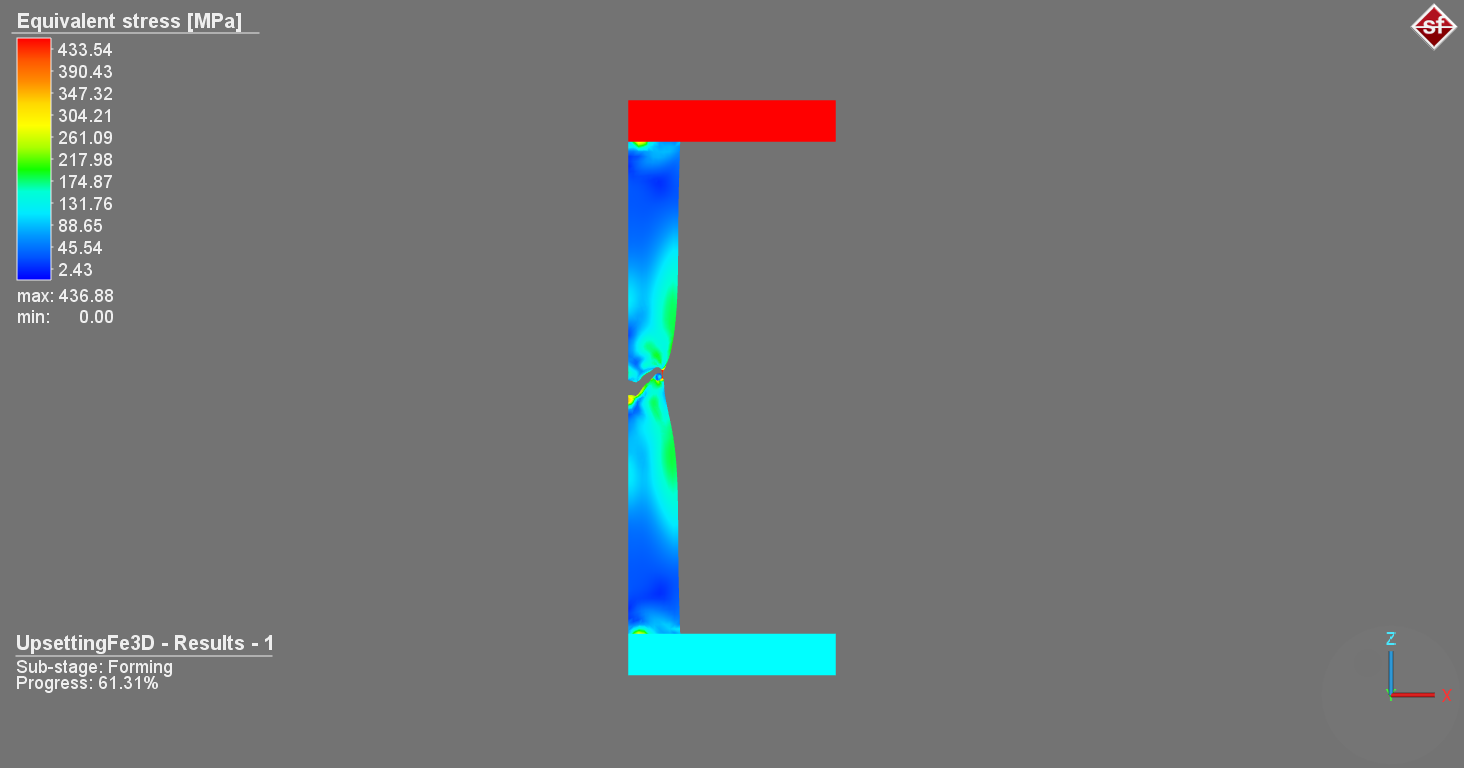
VIRTUAL TESTING
Various virtual tests can be performed using SIMUFACT.FORMING, like Tension Test and Bending Test. Here is an example for a tension test performed by SIMUFACT.FORMING, the appearing colors are contours of stresses that give an indication on the position of fracture and how it develops.
These tests are run to comply with the international standards that is discussed in the next section.
STANDARD COMPLIANCE CODES FOR REBAR & STEEL PROFILES
We comply in our designs with the international standard codes with the newest updates requiring Finite Element Analysis (FEA) and
analytical computational techniques. Our aim is to achieve better design results with much savings in the material and thickness which
eventually reflects on the cost of production and manufacturing.
Steel grades to classify various steels by their composition and physical properties have been developed by a number of standards organizations:
For alloys in general (including steel), unified numbering system (UNS) of ASTM International and the Society of Automotive Engineers (SAE).
American steel grades : AISI/SAE steel grades standard
British Standards
International Organization for Standardization ISO/TS 4949:2003
European standards - EN 10027
Japanese steel grades : Japanese Industrial Standards (JIS) standard and NK standard
Germany steel grades : DIN standard
China steel grades : GB standard
Russia steel grades : GOST standard
Spain steel grades : UNE standard
France steel grades : AFNOR standard
Italy steel grades : UNI standard
Sweden steel grades : SIS standard
Norway steel grades : DNV standard